Note
Go to the end to download the full example code
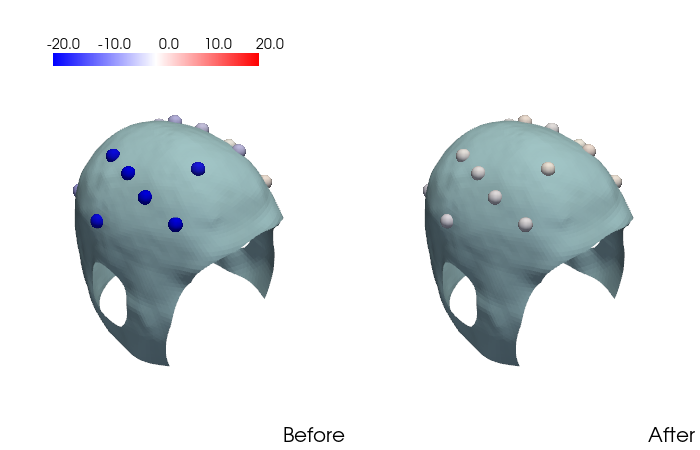
03. Helmet field mapping#
Example demonstrating how to map the background field on the helmet.
# Authors: Mainak Jas <mjas@mgh.harvard.edu>
#          Padma Sundaram <padma@nmr.mgh.harvard.edu>

import json
from pathlib import Path

import matplotlib.pyplot as plt
import numpy as np

import mne
import pyvista as pv
import pyvistaqt as pvqt

from opmcoils.analysis import get_good_chs, load_remnant_fields
Filenames for the mapping
project_dir = Path.cwd() / 'data'
info_fname = project_dir / 'helmet_99channel_size-60.fif'
fnames = [project_dir / 'Bxyz_0mA.txt',
          project_dir / 'Bxyz_optimized.txt']
mapping_fname = 'mapping.json'
surf_fname = 'helmet100_rhino_cuts.stl'

pv.global_theme.cmap = 'bwr'

info = mne.io.read_info(info_fname)
Isotrak not found
We have measured the bias for each sensor along its sensitive axis. This is provided as a dictionary
bias = {'00:01': -0.06, '00:03': -0.74, '00:04': 0.51, '00:08': -0.43,
        '00:11': 0.11, '00:14': -0.13, '00:07': -0.42, '00:15': 1.23,
        '00:16': 0.07, '01:01': 0.42, '01:03': 0.19, '01:04': 0.02,
        '01:06': 0.22, '01:08': -0.33, '01:09': 0.30,
        '01:10': -0.12, '01:13': -1.95, '01:14': 0.65, '01:15': 0.27,
        '01:16': 0.62}
We load the data and correct for the bias
data = dict()
labels = ['Before', 'After']
good_chs = get_good_chs(fnames)
for fname, label in zip(fnames, labels):
    data[label] = load_remnant_fields(fname, good_chs, bias=bias)

print(f'Max remnant field: {np.abs(data["After"]).max()} nT')
Max remnant field: 1.8249999952316285 nT
Finally, we plot the field before and after
with open(project_dir / mapping_fname, 'r') as fp:
    mapping = json.load(fp)

plotters = pv.Plotter(shape=(1, 2), window_size=(700, 450),
                      border_color='w')

for plot_idx, label in enumerate(labels):
    plotters.subplot(0, plot_idx)
    locs = list()
    Bz = list()
    for ch in good_chs:
        holder = mapping[ch]
        holder_idx = info['ch_names'].index(f'A{holder}')
        chs = info['chs'][holder_idx]
        ch_loc = chs['loc'][:3] - 5 * chs['loc'][9:12]
        locs.append(ch_loc)
    locs = np.array(locs)

    reader = pv.get_reader(project_dir / surf_fname)
    mesh = reader.read()
    plotters.add_mesh(mesh, opacity=1.)

    pdata = pv.PolyData(locs)
    pdata['values'] = data[label]
    plotters.add_mesh(pdata, scalars="values", point_size=15.0,
                      render_points_as_spheres=True, show_scalar_bar=False,
                      clim=(-20, 20))
    _ = plotters.add_scalar_bar('', interactive=False, vertical=False,
                                title_font_size=10, label_font_size=14,
                                fmt='%10.1f', position_x=0.15, position_y=0.85,
                                width=0.6)
    plotters.add_text(label, font_size=8, position='lower_right')
plotters.link_views()
plotters.show()
Total running time of the script: (0 minutes 0.524 seconds)